
The week’s largest MLB market flip
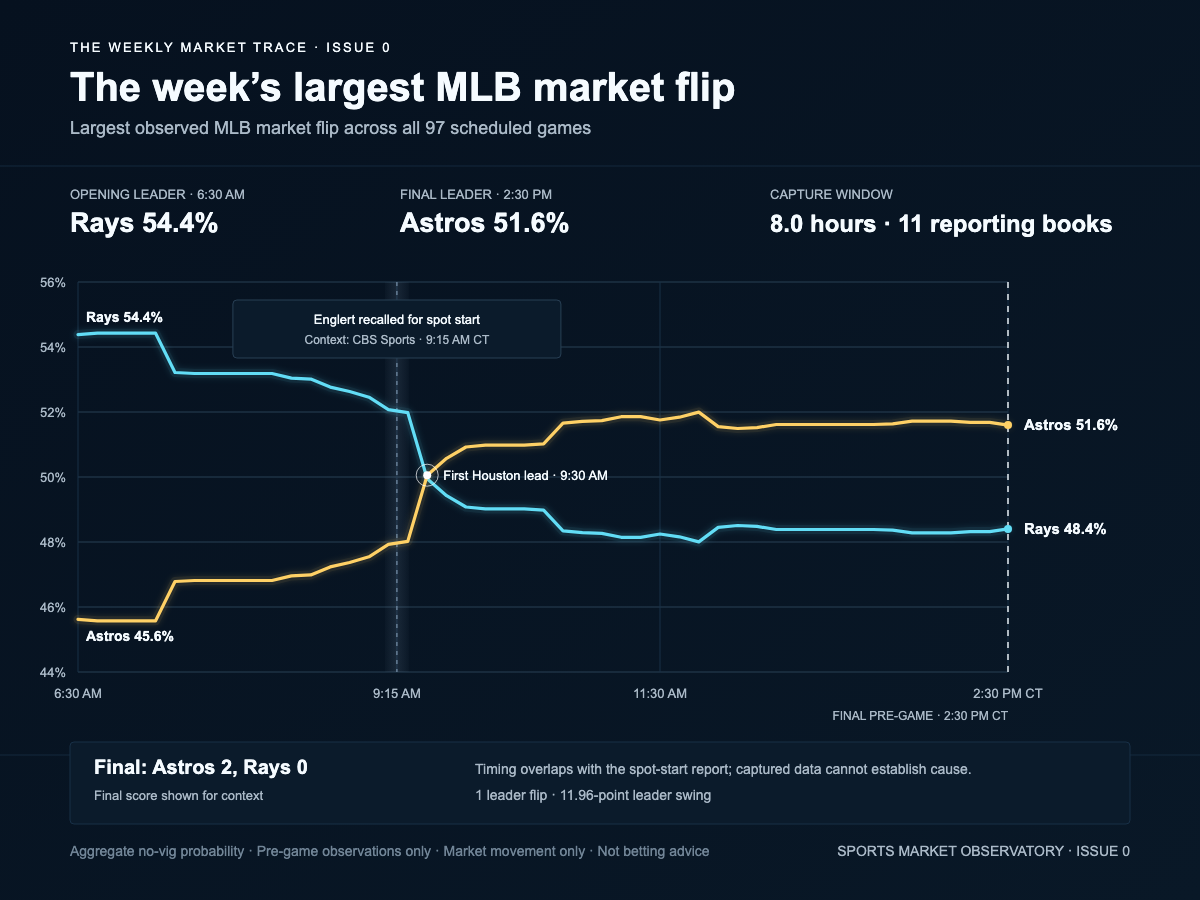
Tampa Bay led at the beginning of the displayed trace, but Houston entered as the final pre-game leader after an 11.96-point leader swing.
What changed
Reading the trace.
Tampa Bay led 54.4% to 45.6% at the beginning of the displayed trace. Eight hours later, Houston held the final pre-game edge at 51.6%—the largest observed MLB market flip across all 97 scheduled games in the July 4–10 window.
Houston first moved ahead in the captured trace shortly after a reported spot-start roster update. That timing is useful context for reading the movement, but the trace alone cannot establish that the update was the market’s only driver.
The notable feature is not merely that the probabilities changed. The identity of the market leader changed and remained changed through the final pre-game check.
Context sources
Scope and method
Aggregate prices were normalized into market-implied win probabilities. The displayed trace begins with the first observation meeting the coverage threshold and ends at the final pre-game check.