Football · Cross-market comparison
Same top-three share. Very different football fields.
The top three held about 28% in both markets, but the NFL distributed title share across much more of its listed field.
Read the trace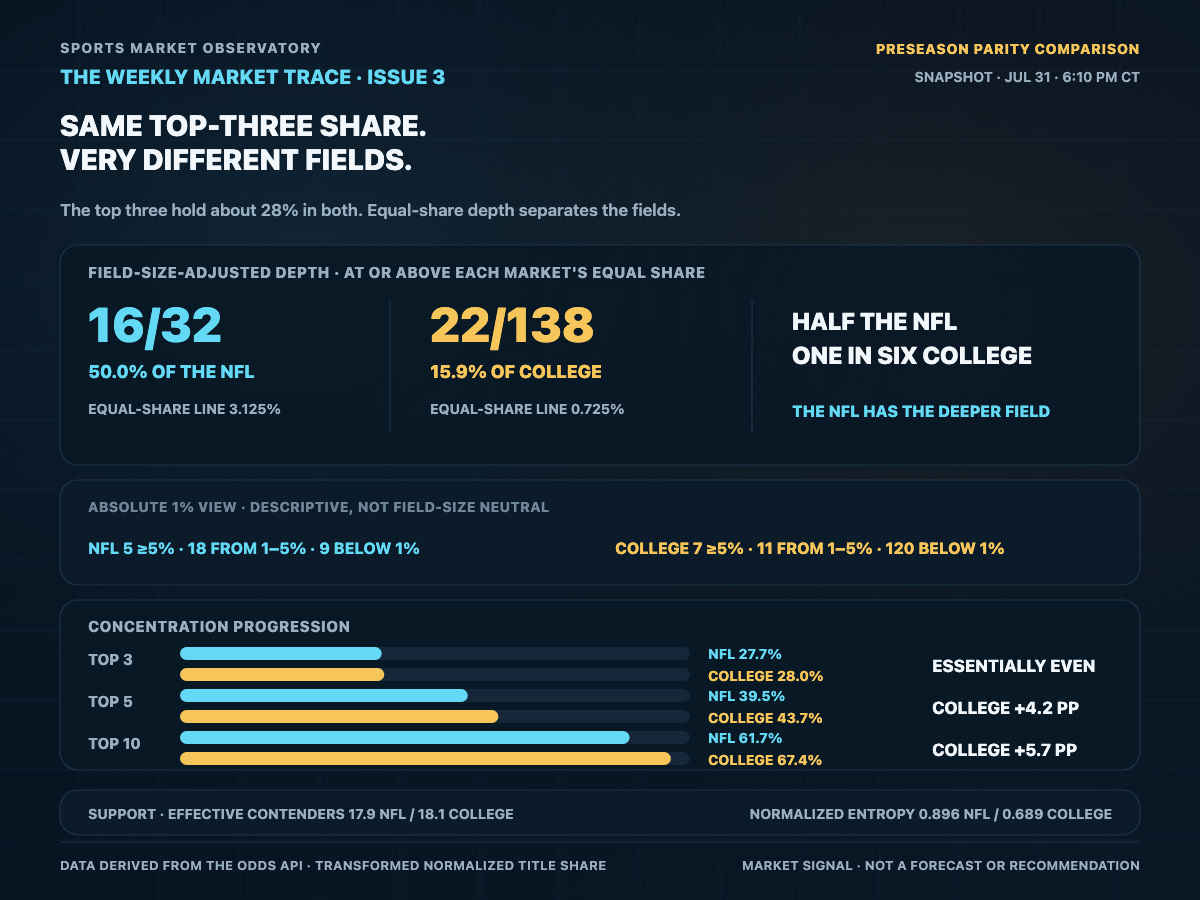
 Sports Market Observatory
Subscribe
Sports Market Observatory
Subscribe
Sports Market Observatory
Sports Market Observatory tracks how betting markets change before games and turns those shifts into clear, timestamped visual stories. Get the free Weekly Market Trace every Sunday.
Repeated pre-game snapshots · Market-implied probability
Latest Market Stories
The weekly editorial selection now has a permanent home—chart, measurements, scope, and all.
Football · Cross-market comparison
The top three held about 28% in both markets, but the NFL distributed title share across much more of its listed field.
Read the trace
NFL · Futures field
The Rams led at 13.36%, 5.95 points ahead of Buffalo, while 18 teams sat between the absolute 1% and 5% lines.
Read the trace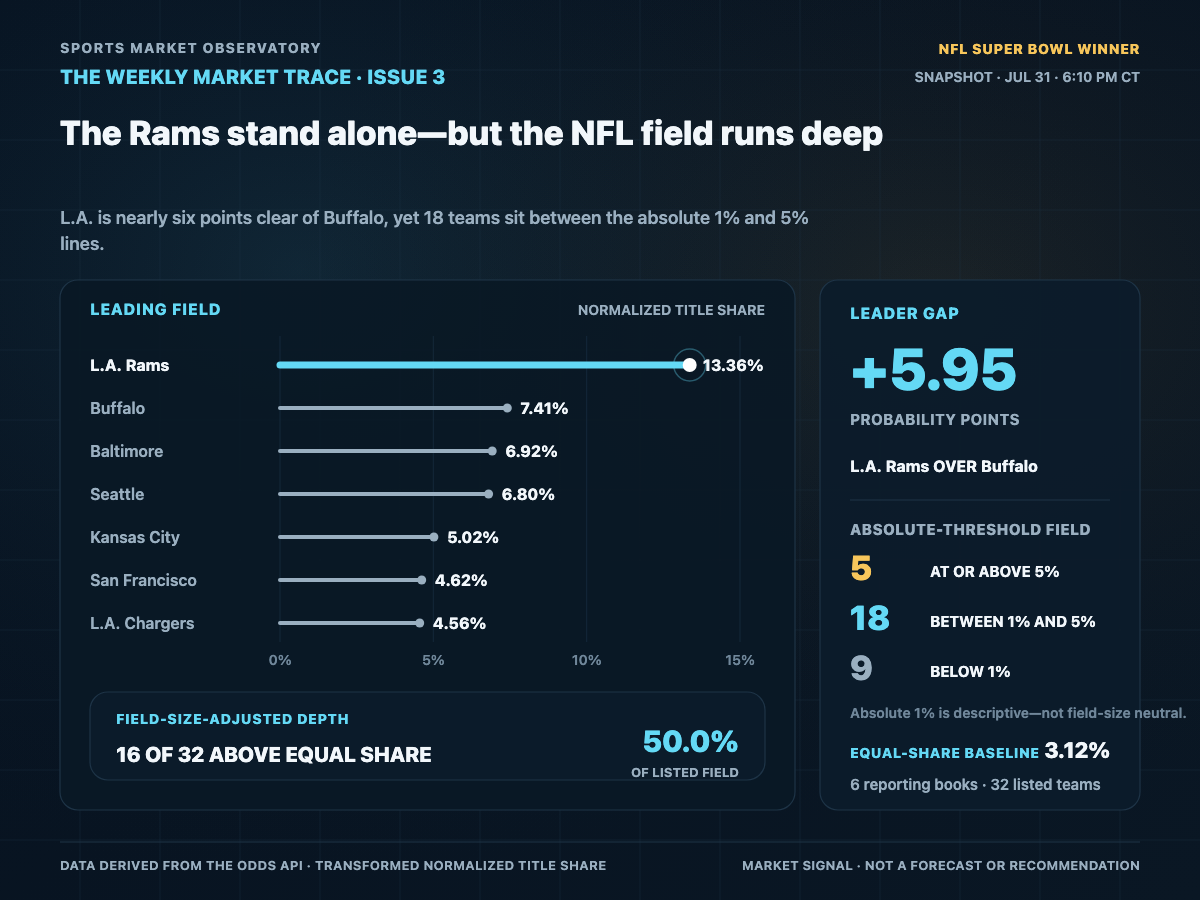
College football · Futures field
Ohio State led Notre Dame by only 0.53 points, seven teams cleared 5%, and 120 of 138 listed teams sat below 1%.
Read the trace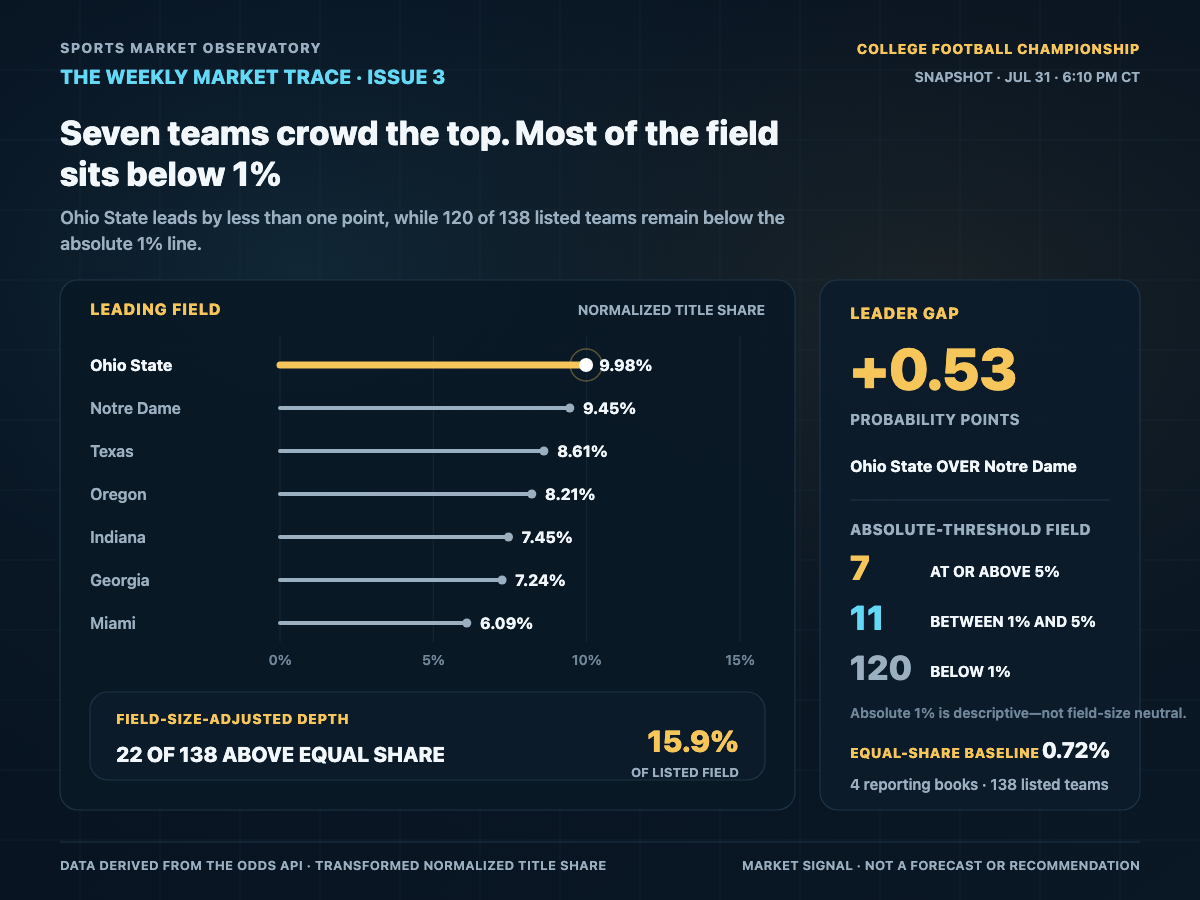
What we track
How aggregate market-implied chances shift before start time.
When the leader changes, or a matchup moves toward a tighter field.
How championship probability mass moves across the field.
How win, draw, and opponent states change before start time.
How it works
We normalize prices across multiple books into aggregate implied probabilities, then chart how that consensus changes before start time.
The Sunday digest
A concise Sunday look at pre-game movement, futures drift, and the market stories that stood out.
Each visual combines repeated market observations into a clear view of movement, timing, and coverage.