
Expected scoring fell 1.5 runs. The favorite finished almost unchanged.
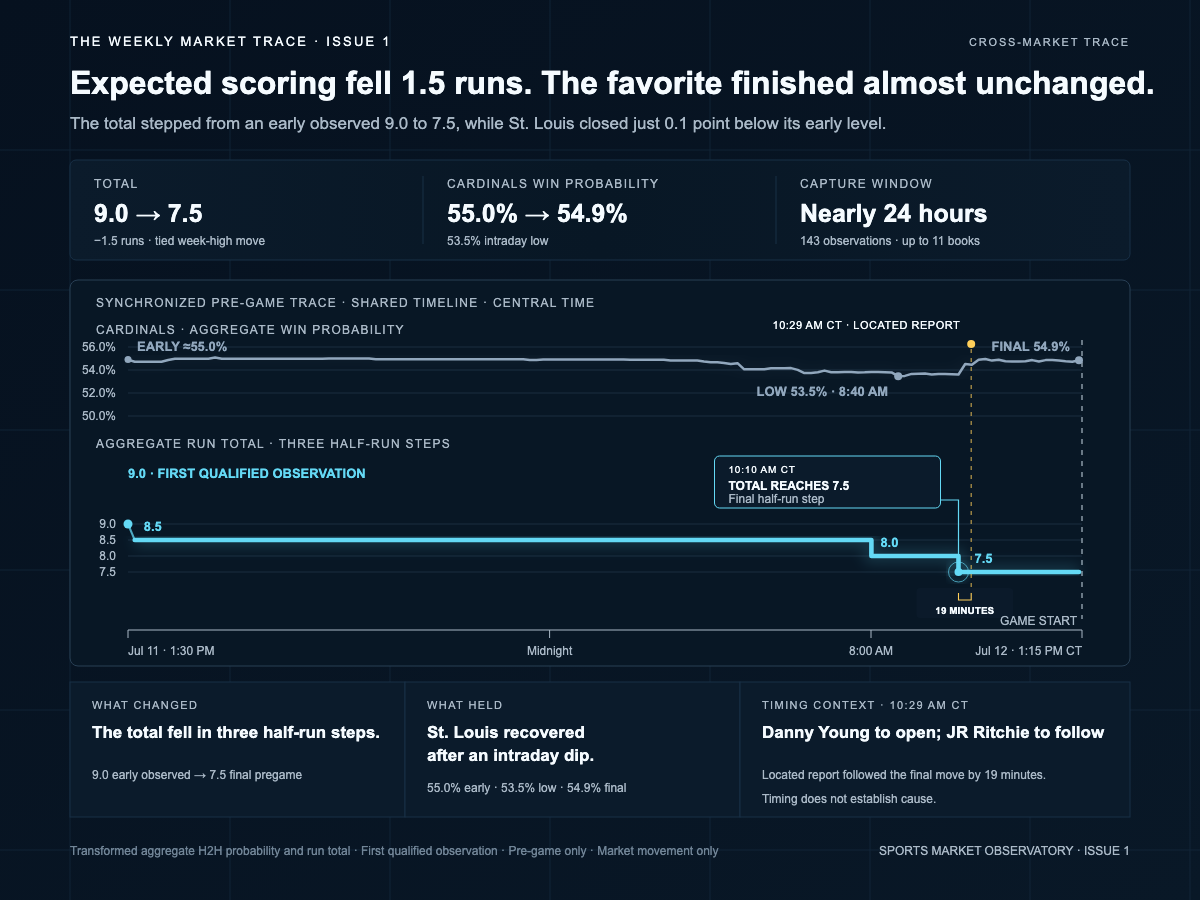
The aggregate total stepped from 9.0 to 7.5 while St. Louis moved from approximately 55.0% early to 54.9% at the final check.
What changed
Reading the trace.
The transformed aggregate total moved in three half-run steps: 9.0 at the first qualified observation, then 8.5, 8.0, and 7.5 before first pitch. The 1.5-run move tied the largest absolute pre-game total change observed during the week.
The side market was much quieter. St. Louis began near 55.0%, dipped to 53.5% during the morning, and finished at 54.9%—just 0.1 probability point below its early level.
The total reached 7.5 at 10:10 AM Central. A located report at 10:29 said Danny Young would open, with JR Ritchie following in bulk relief. Because the report followed the final move by 19 minutes, it is useful context but cannot be presented as the cause.
Context sources
Scope and method
The two panels share one pre-game time axis. The H2H panel shows transformed aggregate win probability; the total panel shows the transformed aggregate scoring line. The later report is displayed as chronology, not evidence of cause.