
Same top-three share. Very different football fields.
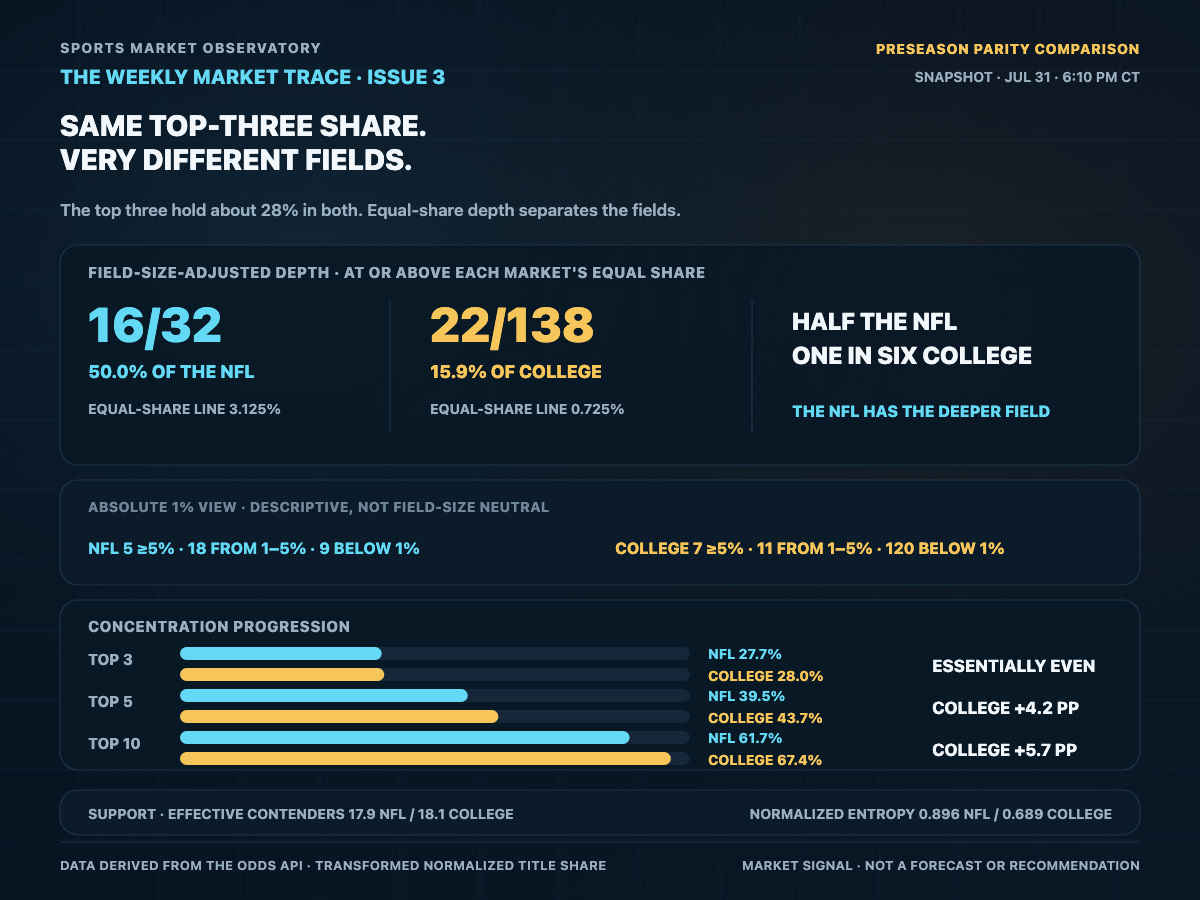
The top three held about 28% in both markets, but the NFL distributed title share across much more of its listed field.
What changed
Reading the trace.
At the final July 31 refresh, the top three teams held 27.69% of normalized title share in the NFL and 28.04% in college—nearly the same concentration at the top. The shapes separated farther down the board: college held 4.19 more probability points in the top five and 5.67 more in the top ten.
Field-size-adjusted measures told a different part of the story. The effective contender counts were nearly tied at 17.94 for the NFL and 18.09 for college, but normalized entropy was higher in the NFL. Half the NFL field—16 of 32 teams—cleared its 3.125% equal-share baseline, compared with 22 of 138 college teams clearing 0.725%.
The shared absolute 1% line remains useful for describing each field, but it is not a field-size-neutral parity test. One percent is 0.32 times the NFL equal-share baseline and 1.38 times the college baseline. College coverage also varied by team; a missing-as-zero sensitivity check left the threshold counts and the crowded-elite, long-tail interpretation unchanged.
Scope and method
Each reporting book’s listed outright market was normalized to 100%. Team values were averaged across books listing that team, then the aggregate team means were rebased within each market. Six complete NFL boards and four college boards contributed to the July 31 capture; college team coverage varied by book.